Analytical Services, Dashboards & Digital Services
The analytical landscape is one that is very much in flux. Big Data, cloud services, advanced analytics, data science, artificial intelligence, and machine learning are continually innovating & being implementing within organizations to maximize operational effectiveness and competitive advantage. There is a big shift towards businesses leveraging self-service analytics and will become an increasingly important component of a pervasive modern analytics platform deployment.
Organizations will continue to transition to easy-to-use, fast, agile, and trusted modern analytics platforms deployed across the enterprise to create business value from deeper Insight into diverse data sources.
Choose Y&L for a scalable, coherent Analytics & Data Science implementation that is adaptable to your changing data requirements. We enable access to accurate and intuitive data for faster and improved decision making, and we implement the appropriate data governance, master data management, and data quality procedures to keep your organization’s data clean, trustworthy, and readily available.
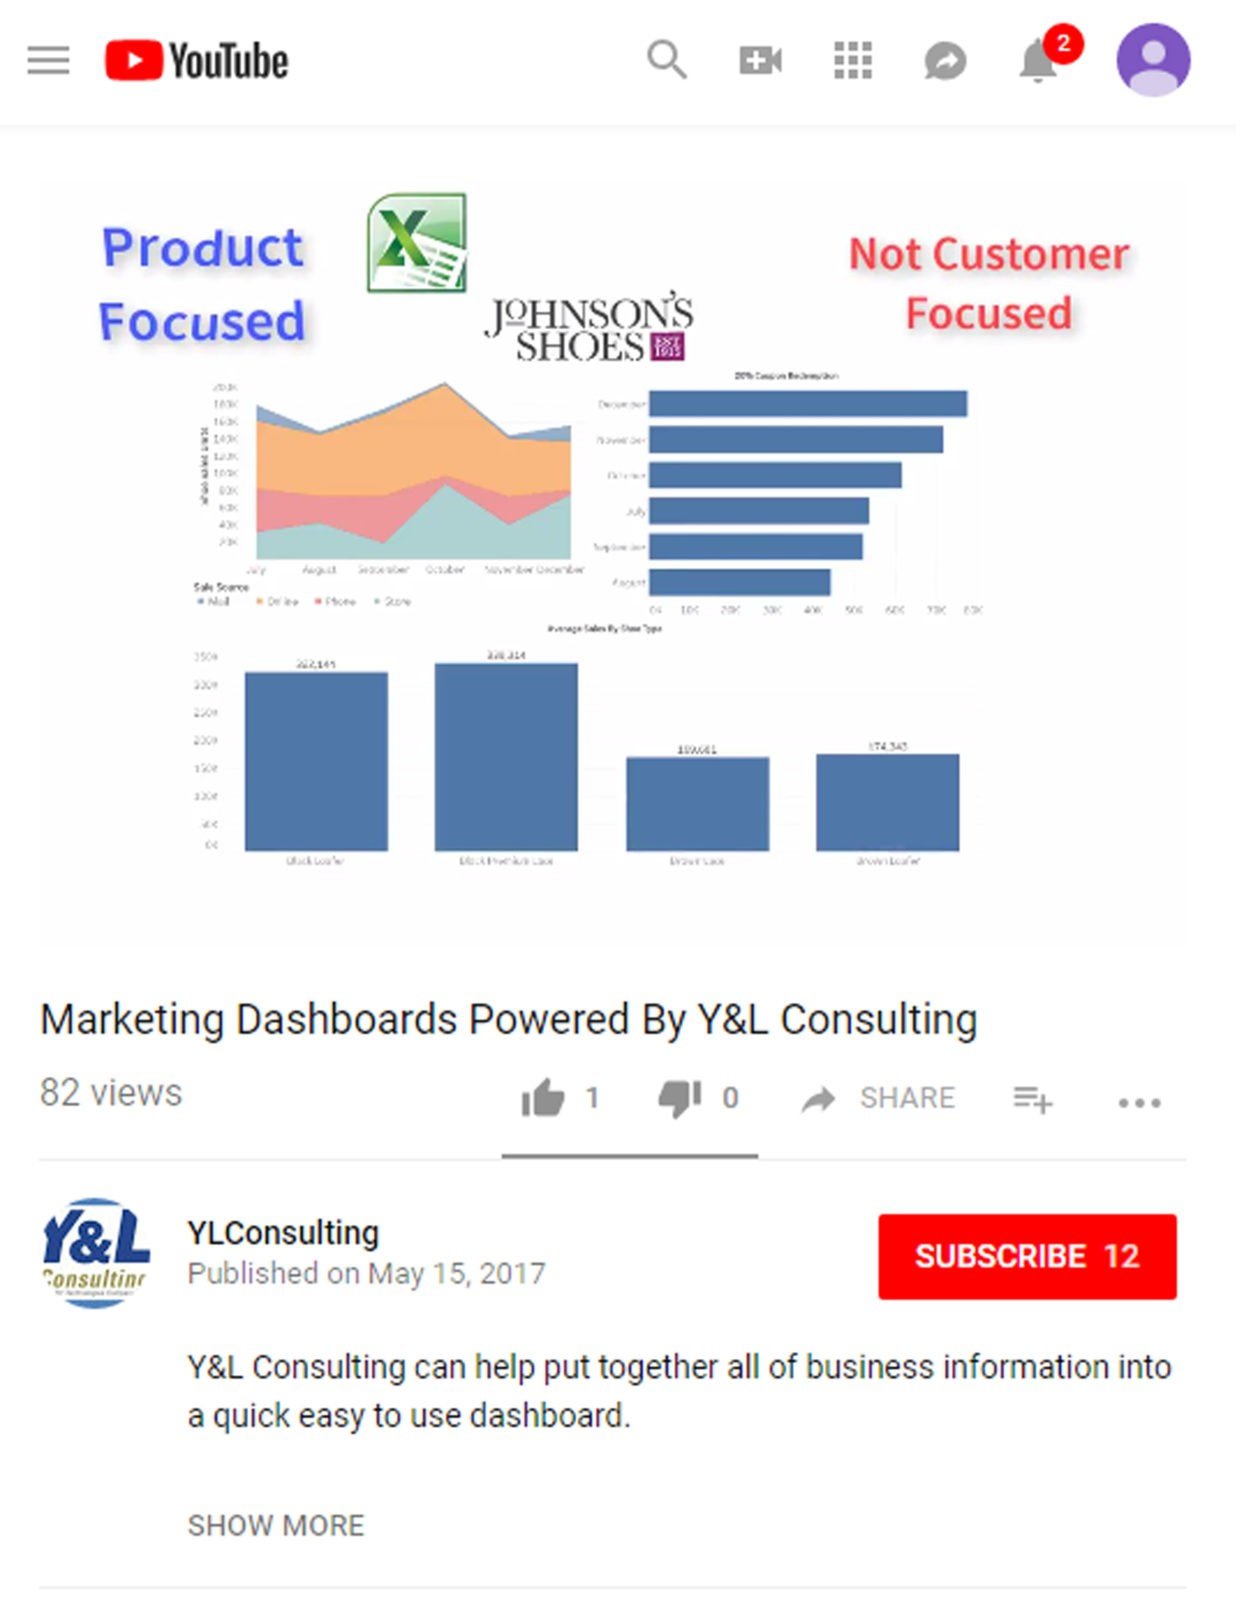
Visualizations & Dashboards
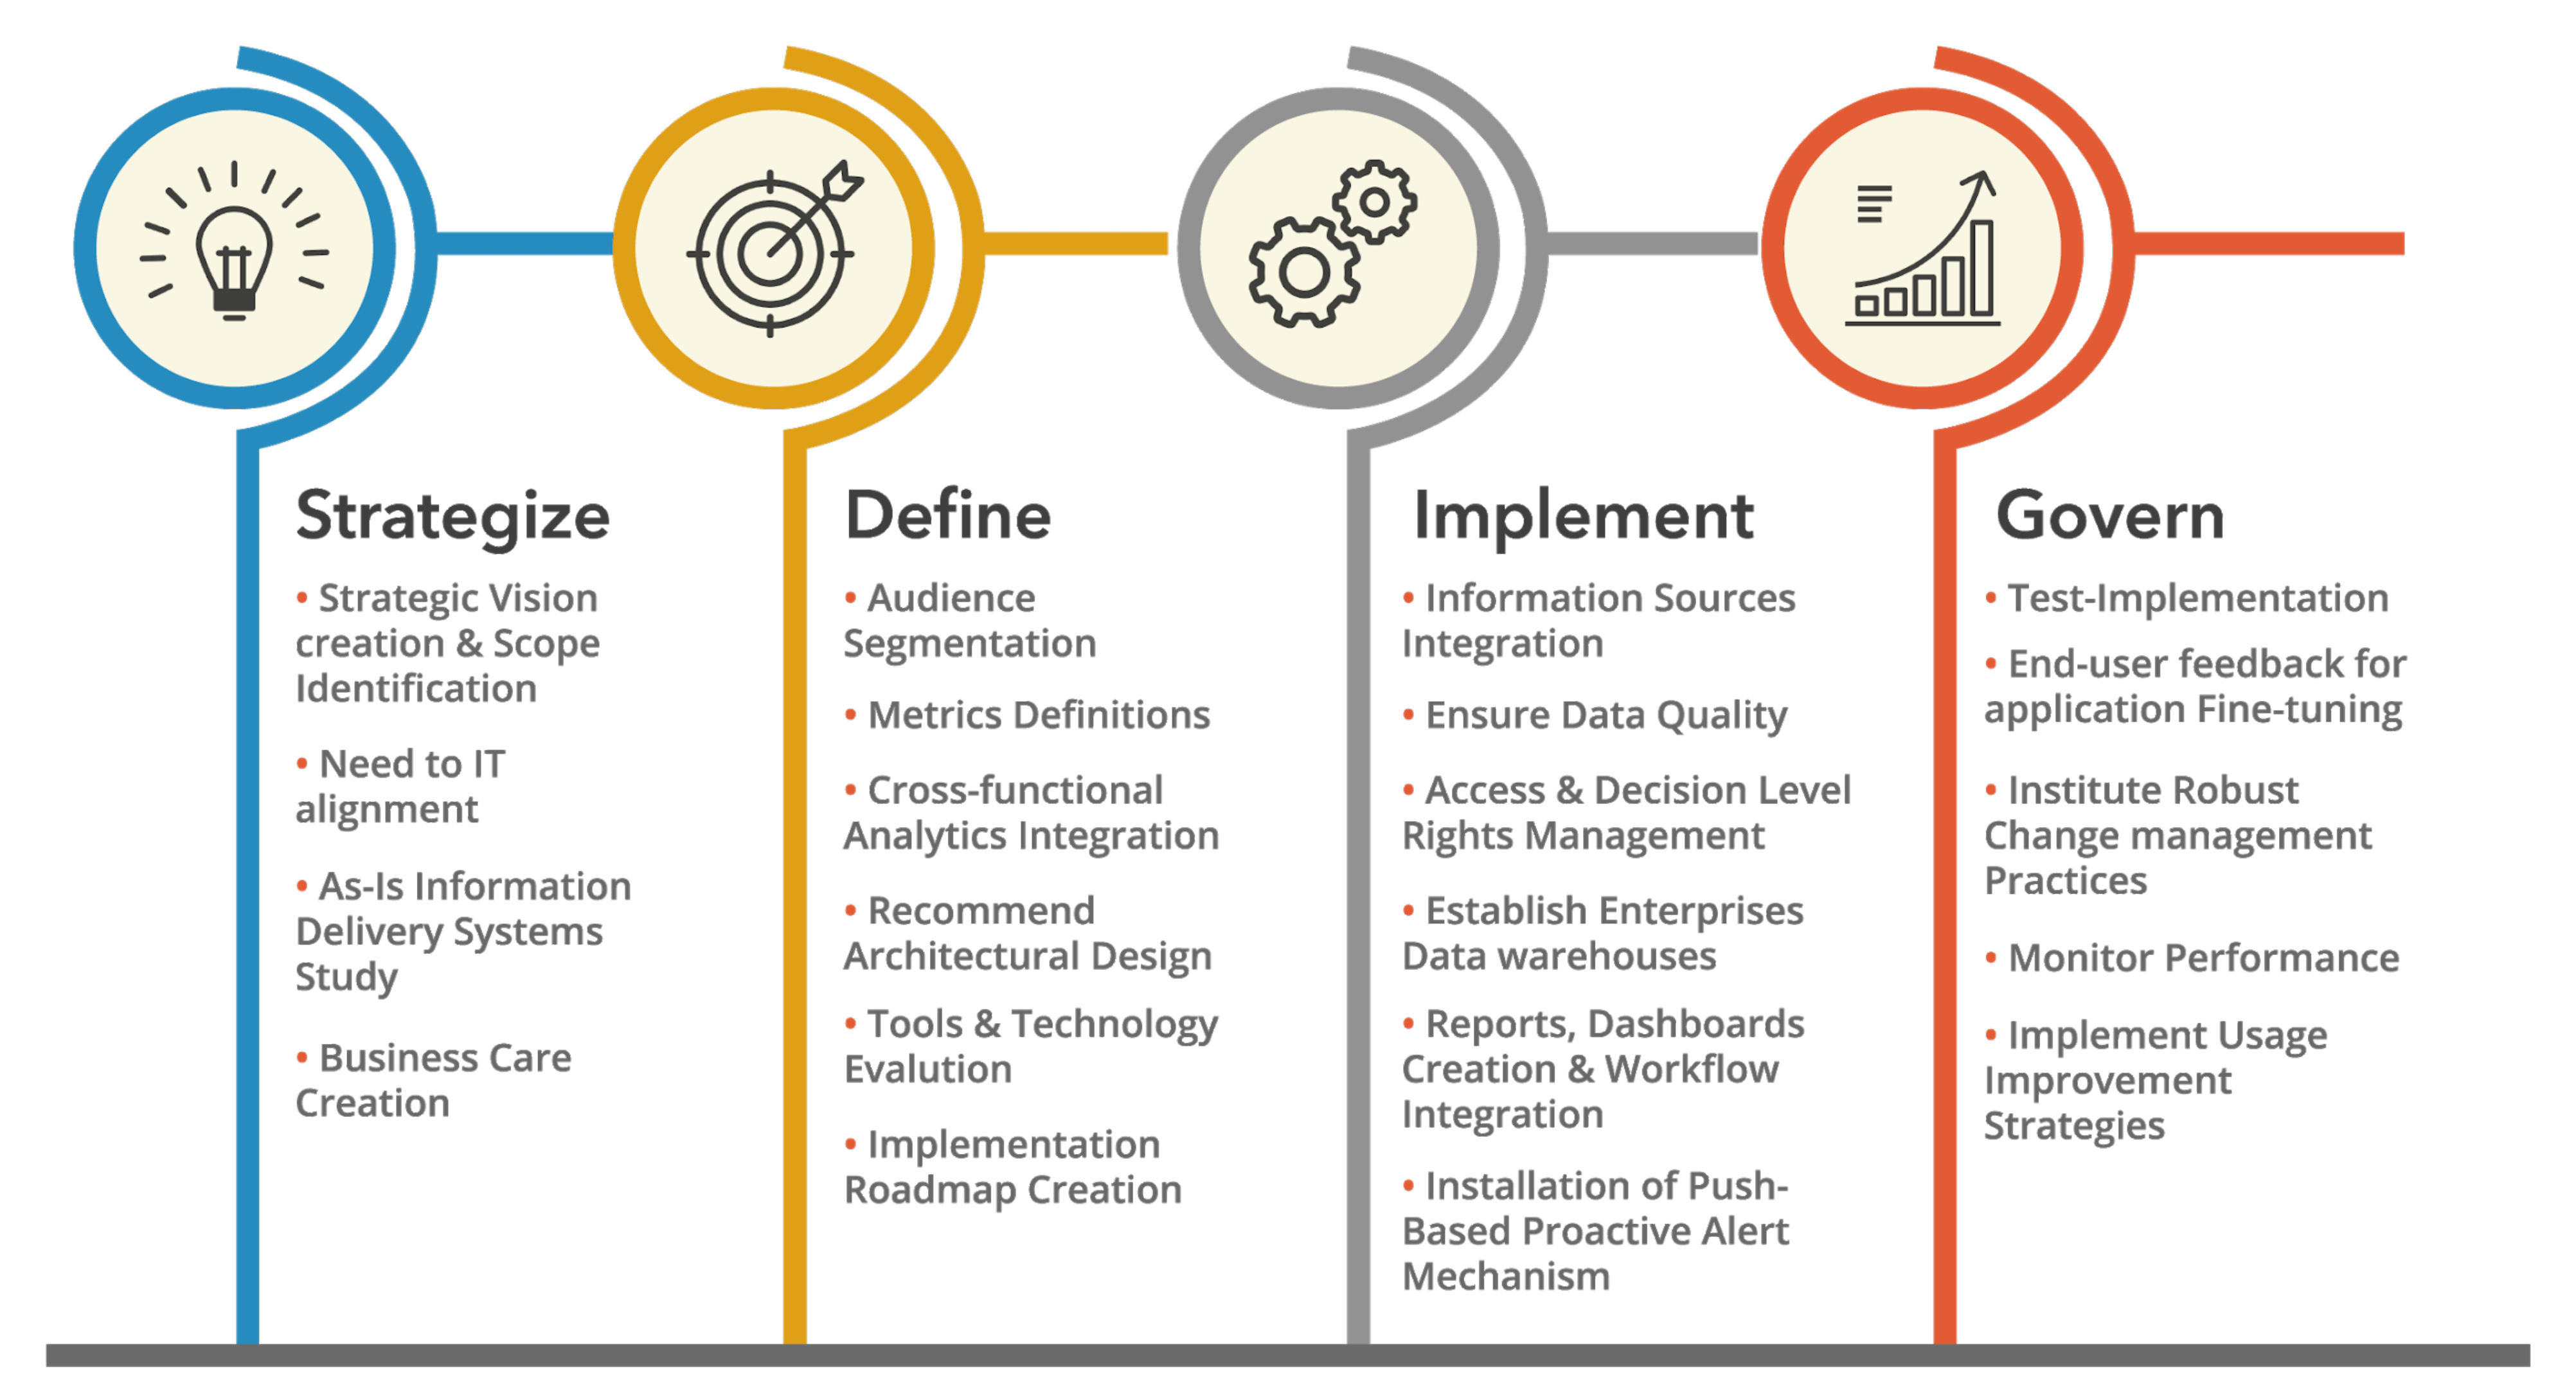
Our Approach
Y&L with its domain expertise (gained through implemented ERP & EIM applications all over the globe)… coupled with superior technical knowledge and above all, the ability to combine Information Technology and Information Systems to translate them as business technology and business solutions is ideally poised to partner with you in your quest to continued business improvements.
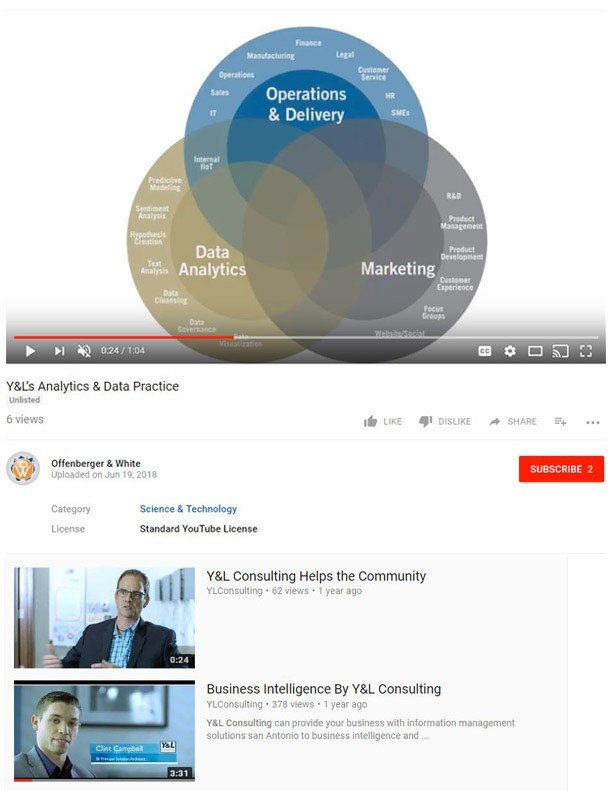
Through combining data, both internal and external, structured and unstructured (video, voice, text, images, social, et al.), the Y&L Analytics & Data Practice identifies and implements the appropriate algorithms, data infrastructure, and strategic roadmaps to either predict or optimize value through a true understanding of the business.
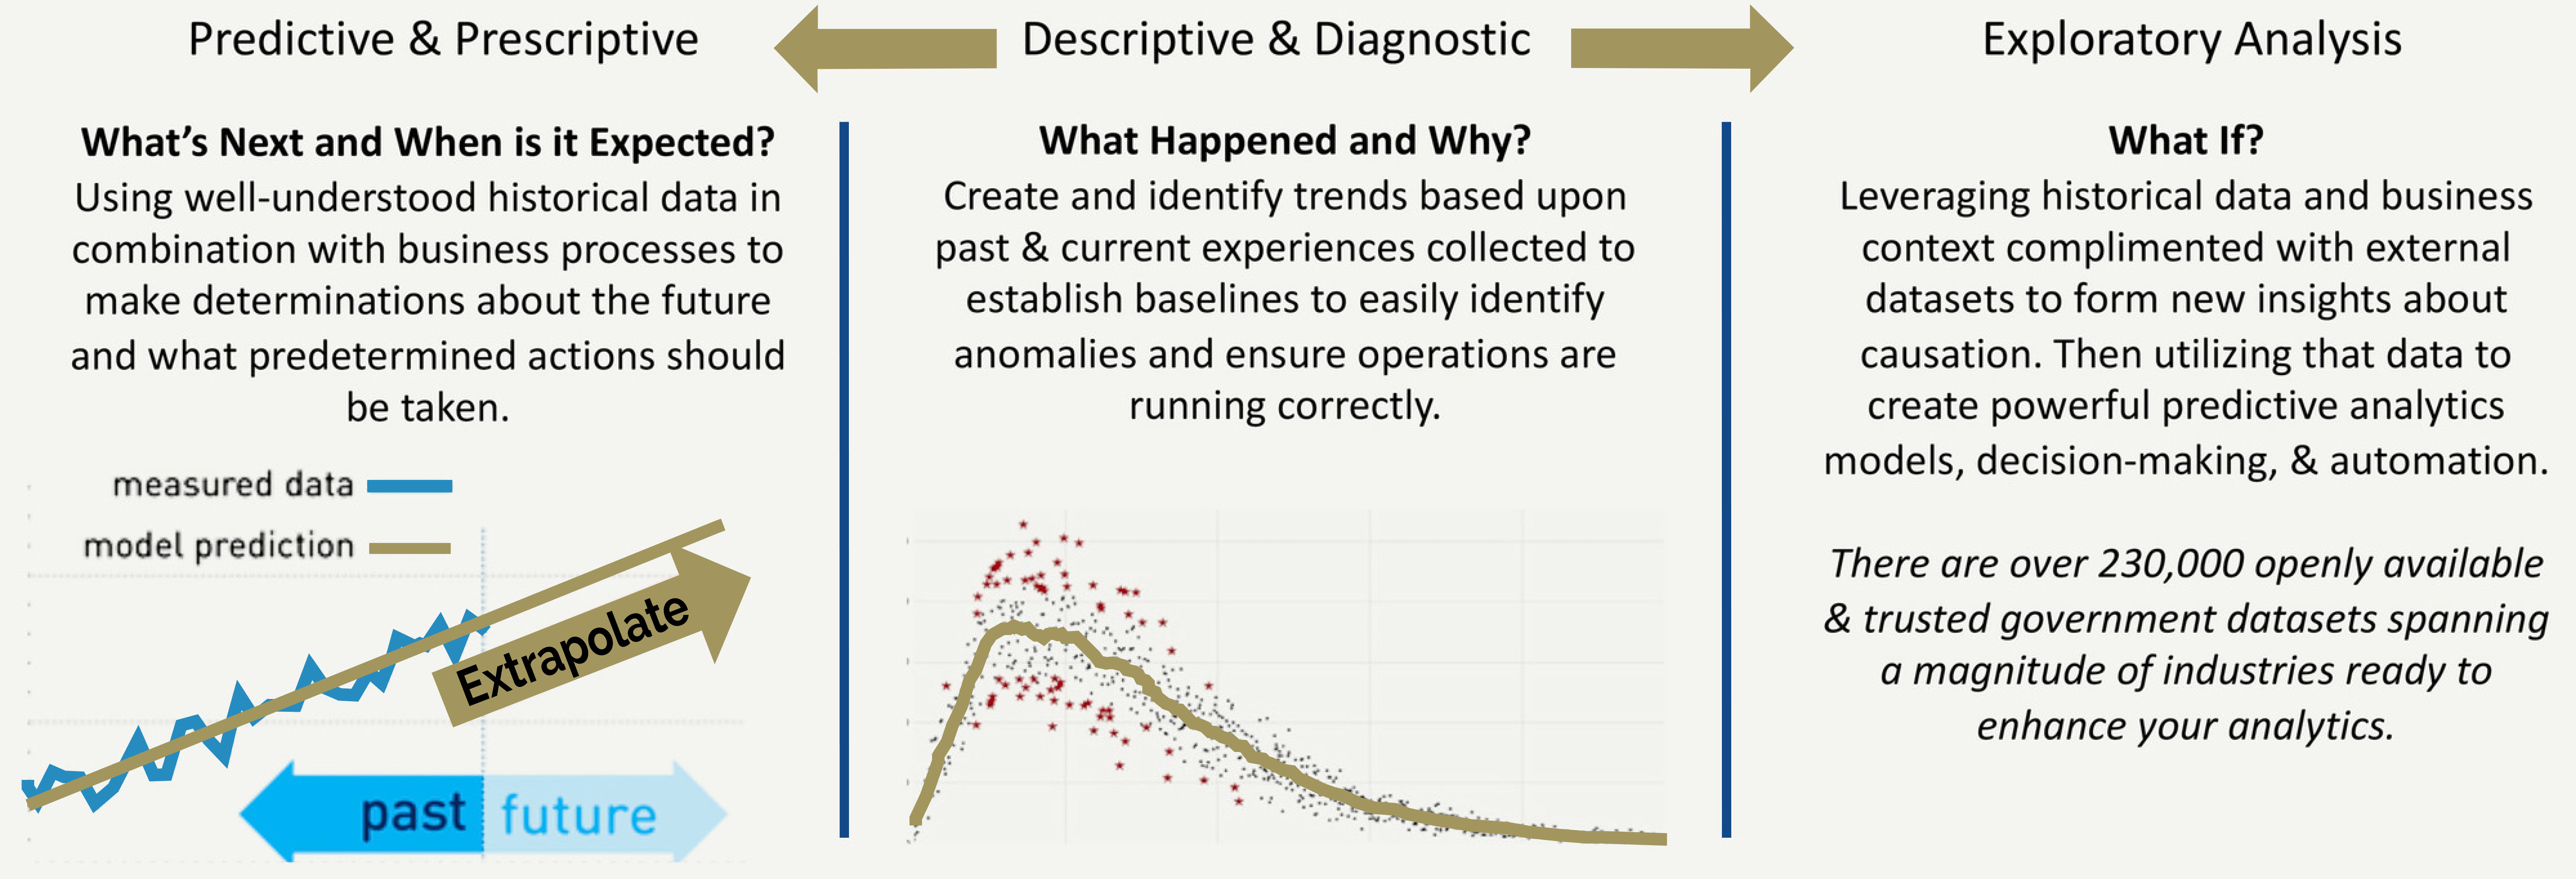
Analytical Services
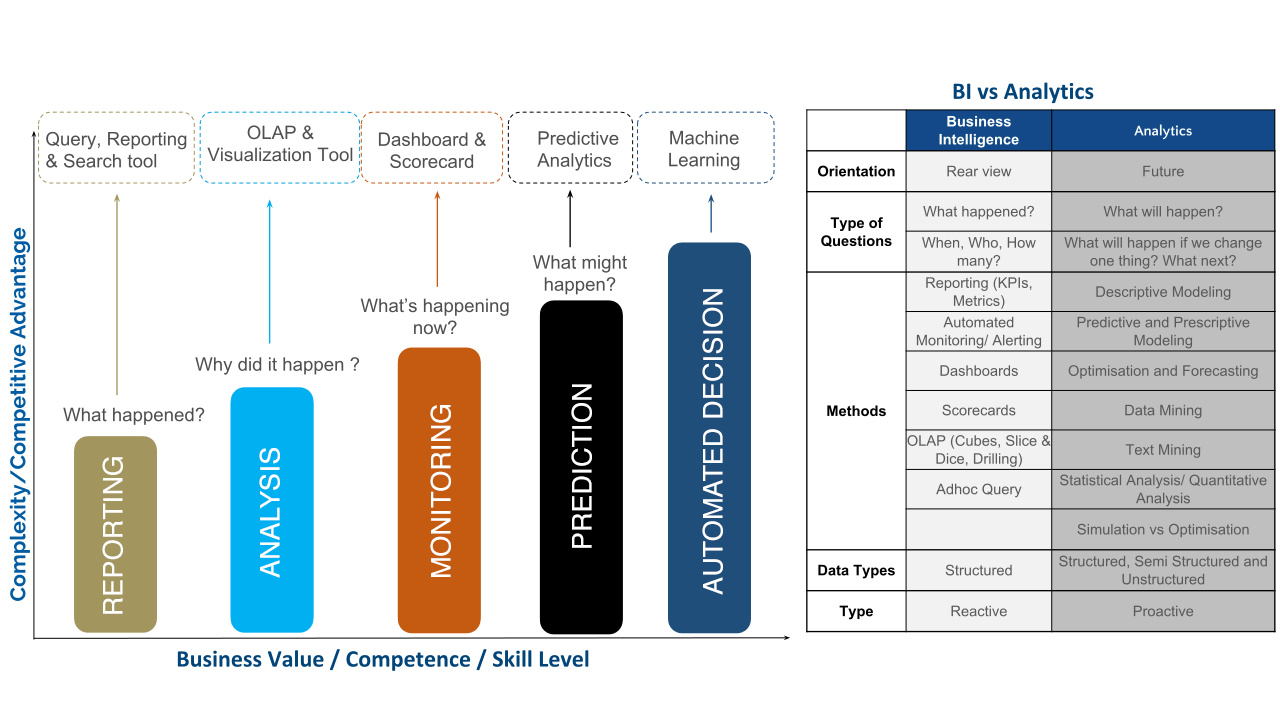
- Exploratory – an approach that employs a variety of techniques to maximize insight into a data set, uncover underlying structure, extract important variables, detect outliers and anomalies and test underlying assumptions.
- Descriptive – What is happening currently, based on incoming data. Typically, a real-time dashboard and/or email reports.
- Diagnostic – A look at past performance to determine what happened and why. The result of the analysis is often an analytical dashboard.
- Predictive – An analysis of likely scenarios of what might happen. The deliverables are usually a predictive forecast.
- Prescriptive – This type of analysis reveals what actions should be taken. This is the most valuable kind of analysis and usually results in rules and recommendations for next steps.
Value Proposition
Y&L’s global Analytics & Data Science practice encompasses several domains with solutions customized to derive best results for the underlying problems. Y&L’s global Analytics & Data Science practice brings together the latest in Data Science Techniques with leading Business Consulting skills to build models that provide insight and quantify the risks and benefits associated with solutions to complex business problems. The combination of our services portfolio and our global delivery model sets Y&L apart and provides exceptional value for our customers.
Our analytics team brings in-depth knowledge and expertise across a broad spectrum of industries. We believe our client’s success and our growth depends on maintaining strong partnerships with a wide array of key technology vendors and service providers across each of our core capabilities: Big Data, Enterprise Information Management, Business Intelligence and Advanced Analytics. Strategic partnerships with market-leading technology companies allow us to combine best-in-class skills with cutting-edge tools and resources. Key technology partners include: SAP, Oracle, Microsoft, IBM– Cognos, Qlik, and Tableau.
Digital Supply Chain Solutions
Supply Chain Visibility, Responsiveness
Visibility: Complete overview of the company’s supply chain to effectively monitor and modify processes for increased productivity
Responsiveness: A recommendation system to aid the user in decision making by considering various scenarios and how it affects ATP
Resilience: Estimating the tolerances of supply chain considering the risks occuring at various stages to meet the demand
Inventory Modeling
Performing causal analysis to understand the accumulation of inventory, prediction of future inventory levels considering various influencing factors and prevention of inventory pile-up by maintaining the desired stock level.
Transport Cost Optimization
Determination of the most efficient means of transporting goods and products to optimize the costs for transportation.
Vendor Performance & Risk Assessment
Identify, assess, and monitor third-party-suppliers and vendors to assure delivery of services and formulate a risk mitigation strategy.
PO Release-Contextual Intelligence
Real time recommendation to the user as the transaction is in progress to enable effective decision making.
Spend Analytics
Identify the essential spends of an organization which yield returns and which doesn’t to ensure spend optimization.
Liquidity Forecasting/ Cashflow Projections
Estimation of a company’s ability to meet short term operating expenses using projected cash flows.
Smart Factory
Improved processes using historic data from established IoT systems.
Demand Forecasting
Accurately forecast the demand through causal forecasting and sensitivity analysis to understand the impact of different variables on the overall demand.
MRP Optimization
Allocation and Procurement of Raw material as appropriate to minimize costs and wastage through optimization.
Transport Cost Optimization -3PL
Determination of the most efficient means of transportation for third party logistics.
Production Impurity Prediction
Accurate estimation of impurities in the manufacturing line for products.
Production Routing Optimization
Jointly optimizing production, inventory, distribution and routing decisions using inputs from demand planning and inventory control systems, as well as routing constraints, speeds and cycle times to generate optimized production plans.
CAPEX Spend Decisions
Evaluate the impact of the capital spend to the organisation to ensure effective management of finances.
Working Capital Management
Evaluate the financial impact of business decisions at various stages of the processes to provide visibility to the management on the cash flow.
Product Portfolio Optimization
Maximizing revenue by optimizing the quantity of products being marketed.
Digital Customer Experience Solutions
Marketing Mix Model
Analyze historic data to evaluate the effectiveness of the spend allocation for various marketing channels.
Discount Analysis
Understand the effectiveness of the discount/ discounts on the overall sales and enable the management to promote the right discounts to boost the sales and customer loyalty.
Precision Marketing
Use of public data to profile end users for marketing relevant products.
Churn Analysis
Identification of the key reasons for Customer Churn to effectively boost satisfaction levels.
Opportunity Conversion Likelihood Analysis
Predicting the probability of a customer to convert at different stages of the sales cycle. Enables the sales department to improve the success rate and management to accurately forecast revenues.
Chatbot
A neural network based assistant to automatically reply and address queries based on Natural Language Processing Techniques.
POS Log Analysis
Analyze the POS log data to identify the POS machine failure patterns and take corrective actions.
Customer Segmentation
Identify key differentiators to group similar customers into appropriate groups for targeted advertising.
Campaign Analytics
Assessment of the success of marketing campaigns and design of future campaigns.
Recommendation System
Dynamic system to accurately suggest recommendations to customers based on past purchases.
Customer Lifetime Value
Prediction of the entire value derived from a customer during the entire course of connection with the company.
Attribution Model
Evaluation of the impact of marketing campaigns and latent factors into a customer’s decision.
OCR – Text Analytics
Conversion of physical documents into a digital copy using image processing and deriving Insight using AI algorithms.
Sentiment Analysis
Analyze the customer comments/feedback using text analytics to gain valuable Insight to improve the business.
Digital Asset Management Solutions
Predicting remaining useful life of asset
Estimating the remaining life of a machine with data captured from different sensors
Spare Parts Inventory Strategies
Evaluate Company’s capability to respond to a disruption with respect to spare parts.
Throughput Analysis
Evaluate the machine input parameters and identify their influence on the output to ensure better control and maximise the throughput
Rule Based Preventive Maintenance
Rule-Based preventive maintenance dictates that maintenance should only be performed when certain indicators show signs of decreasing performance or upcoming failure
Machine Failure Prediction
Estimation of shutdown of a machine using past failure patterns to schedule maintenance
Anomaly Detection
Use of Sensor data to evaluate abnormal situations to avoid breakdowns
Equipment Performance Analysis
Using Key performance Indicators from complex manufacturing processes to isolate faulty equipment or sequences of equipment
Digital Dashboard Solutions
Digital Dashboard Solutions CEO Dashboard
Overview of key performance indicators and allows making faster decisions using Aggregation, Prediction, Simulation and Regression
Production Dashboard
Panel to display overview of key performance indicators and graphical status of the Production Process
Sales Dashboard
Panel to display overview of key performance indicators and graphical status of the Sales Process
Procurement Dashboard
Panel to display overview of key performance indicators and graphical status of the Procurement Process
Marketing Dashboard
Panel to display overview of key performance indicators and graphical status of the Marketing Process
360 Degree Customer Experience
Multichannel Visibility across various customer experience points to improve the overall customer relationship and lifetime value